Category Archives: Design Process Diagrams
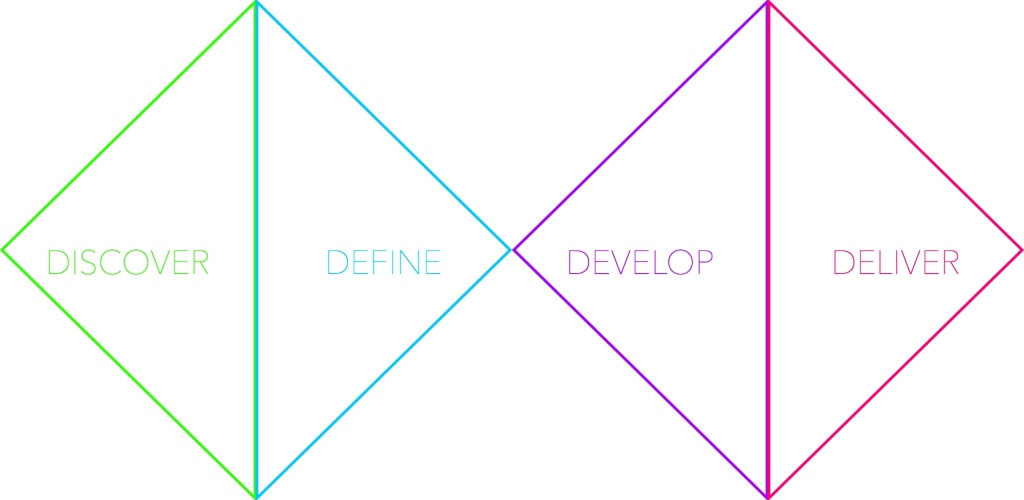
Design Diamond – Sam W., Trent, Sarah, Mini
Discover
We went wide on thinking of ideas of what to map. Below is the list of ideas:
- Railing Architecture; social elements such as Entering and Exiting styles
- Paths to approach the museum
- Food Vendors; placement and type
- Tables at either end of the plaza
- Differences in width of steps and their affect on paths
- Direction of the sun
- Areas of shade and their effect
- Points for photography
- Direction of approach to the museum (hypothesis: subways have an effect)
- Number of people in each group
- Catalyst, or reason for being on the steps, including meeting with coworkers, meeting friends, studying art
- Age of people
- Location of pigeons
- How people pose for photos, or percentage of selfies
- Soundscape, including the water fountains, road noise, and conversations
- Direction people were facing–forward and in staggered elevations
- Smells, such as mustard, hot dogs, and almonds roasted in sugar
- Tactile effects, such as a rigid sitting style and the feeling of stone
Define
We narrowed in to define what was of interest (our criteria was a bit arbitrary, so there’s a problem with the process)
- Railing Architecture; social elements such as Entering and Exiting styles
- Paths to approach the museum
- Areas of shade and their effect
- Points for photography
- Number of people in each group
- Catalyst, or reason for being on the steps, including meeting with coworkers, meeting friends, studying art
- Location of pigeons
- Soundscape, including the water fountains, road noise, and conversations
Develop
We developed the maps through observation and documentation, followed up by conversation
Deliver
We set to work individually to create the deliverables (without much collaboration, another problem with the model)
Filed under Design Process Diagrams
Design Process – Amy, Effy, Melody, Sunnie
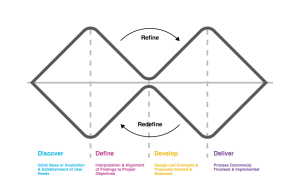
Our group was in agreement that the double diamond diagram did a nice job describing the typical design process in general. If we were to modify it, we might add a feedback loop to capture how the process is often not linear. Part of the development process involves using learnings to help redefine project goals and scope. The process becomes a bit more cyclic in the middle:
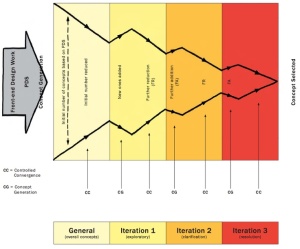
We then found a really nice visual representation that captured our thinking in Bill Buxton’s Sketching User Interfaces. As you can see, Buxton characterizes the design process in a diamond-like manner with breadth and depth phases. But he also accounts for more iterative cycles throughout:
Looking forward to giving this process a try.
Filed under Design Process Diagrams


